Interesting and/or Notable Graphs
The following graphs are presented as being of possible interest to the microanalyst. If you have any questions or concerns regarding the results please contact John Donovan.
Ti in Quartz Detection Limit Measurement, PET, LPET and aggregate intensities.
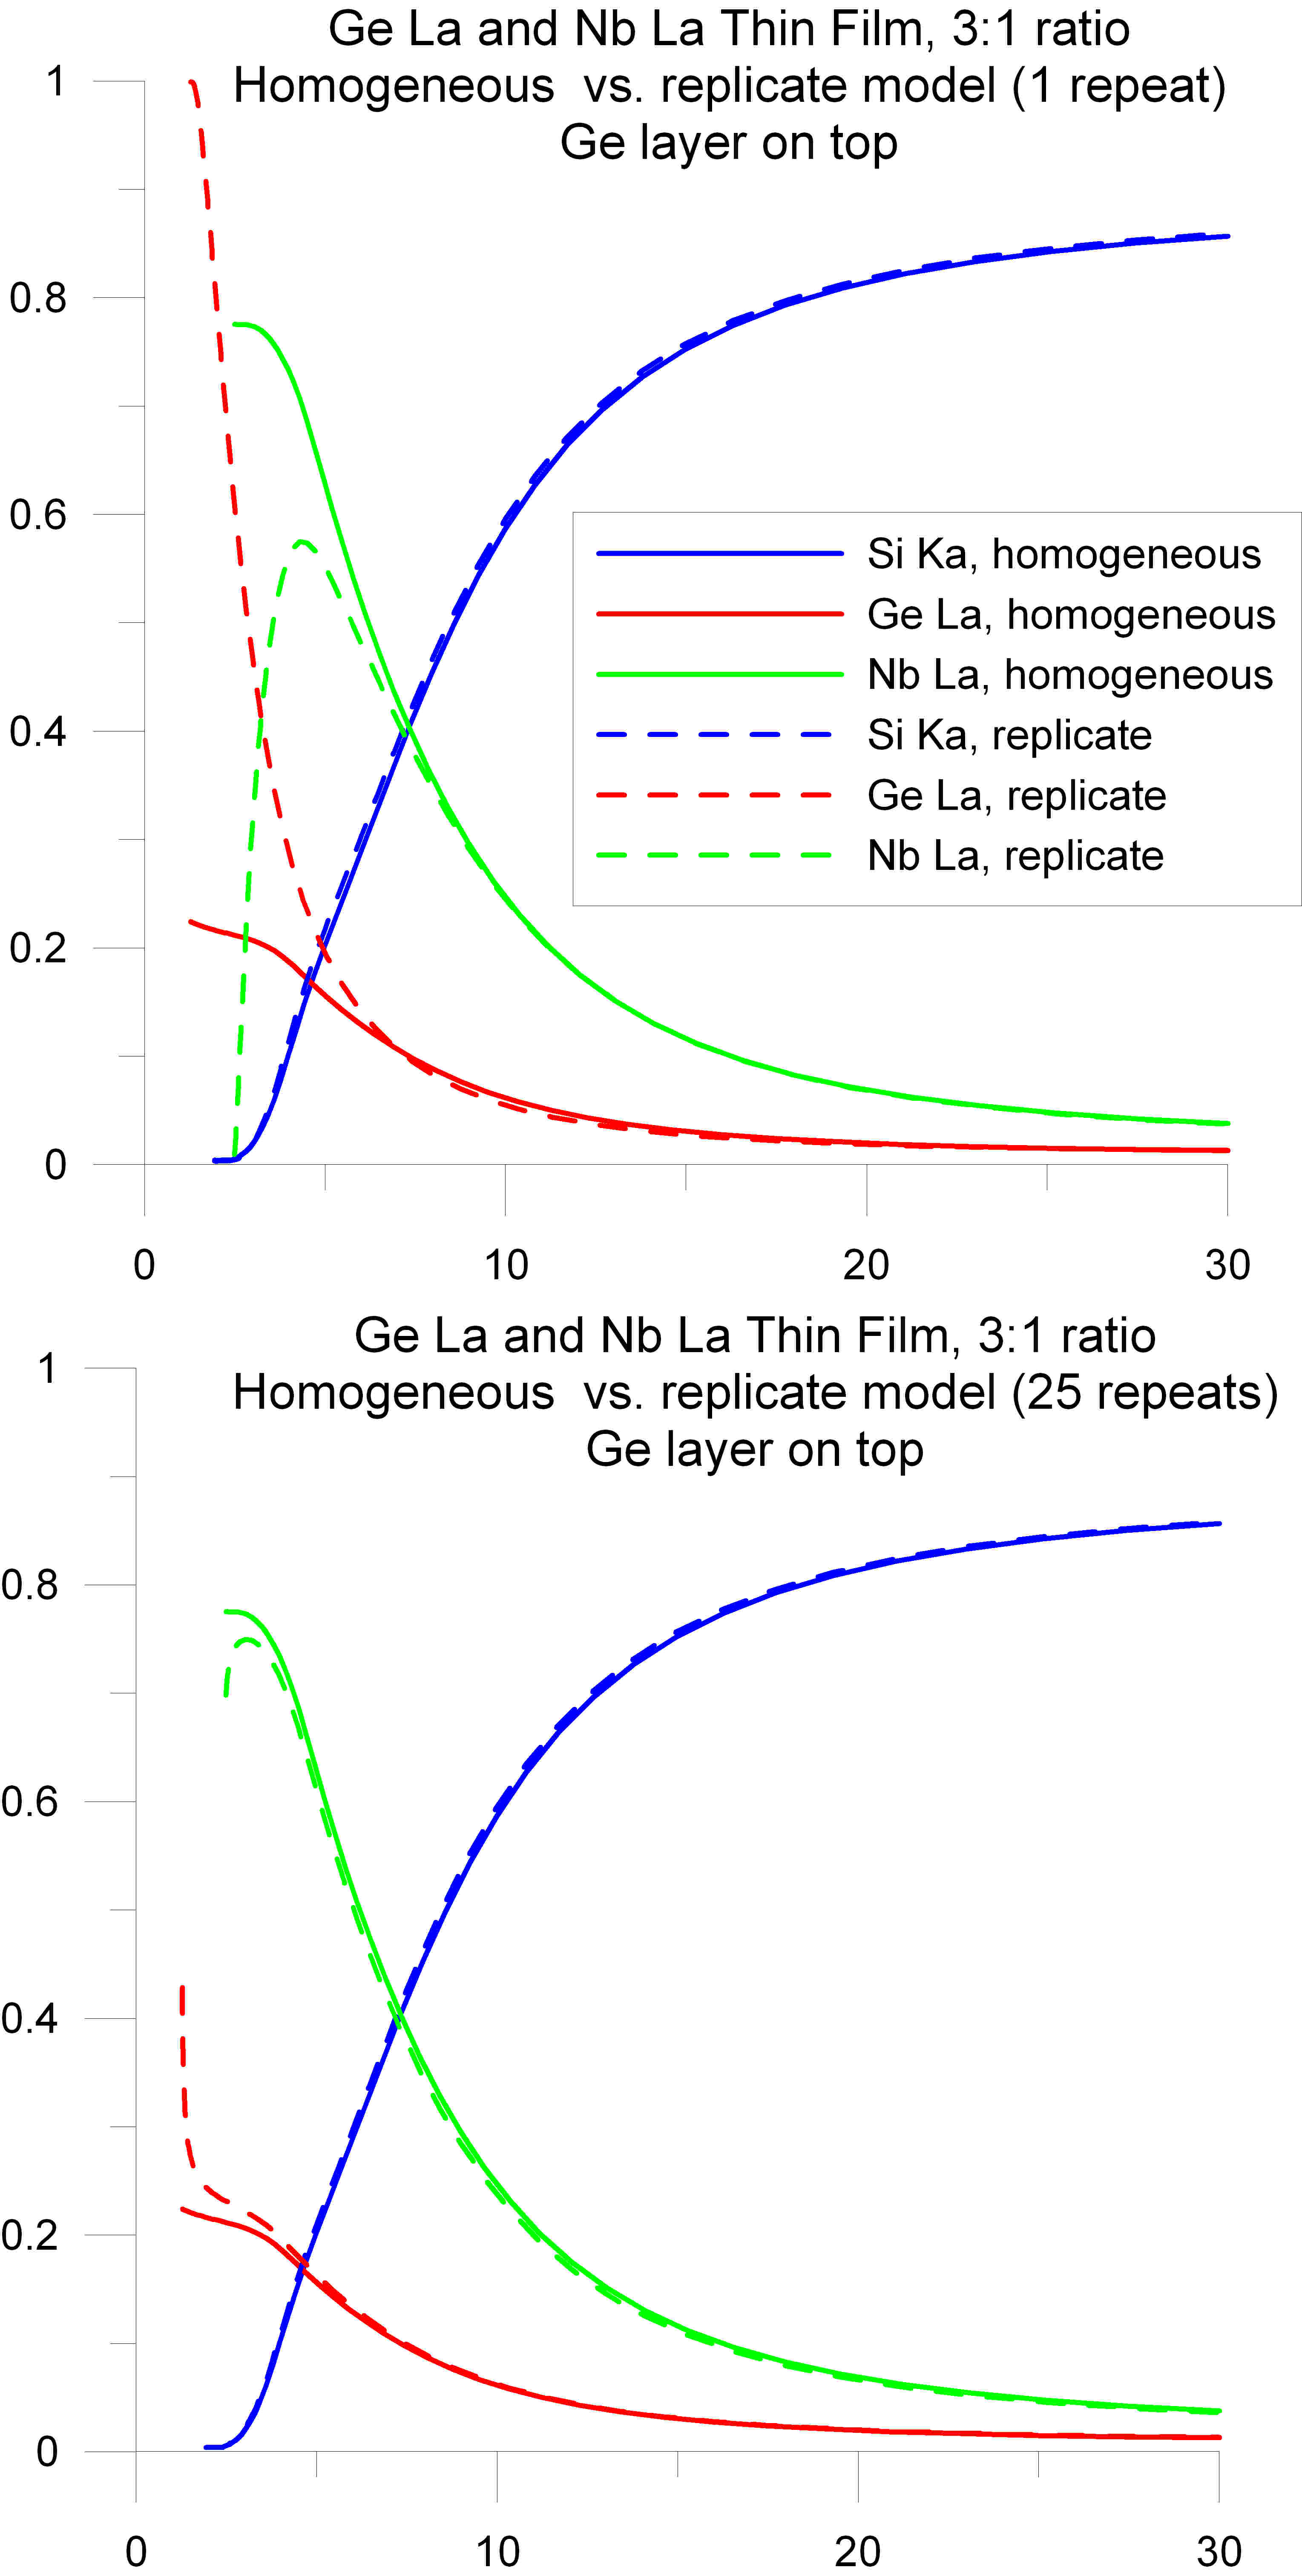
Graphs of two geometric models for thin film recalculation. Homogeneous assumption with all elements in a single layer on a Si substrate versus a replicate assumption with both 1 repeat (top) and 25 repeats (bottom) pairs of Ge and Nb (Ge on top) elemental depositions. Note that the 25 repeat layer model is very similar to the homogeneous assumption down to a few kilovolts of beam energy while the single repeat model diverges at around 5 keV electron beam energy..
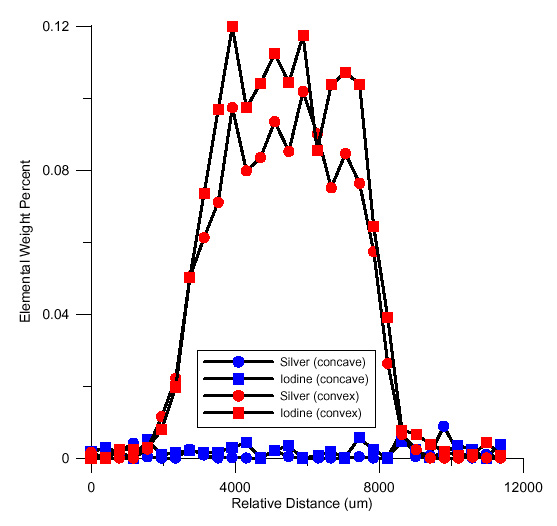
Graph of trace elements in a silicon rubber matrix
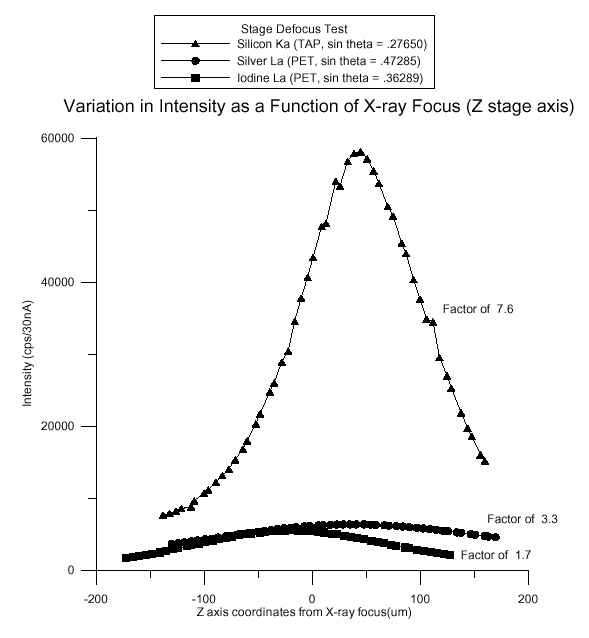
Graph showing relative defocus effects for elements on different analyzing crystals and Bragg angles. Note that Si ka on a TAP crystal is extremely sensitive to stage Z-axis defocussing.
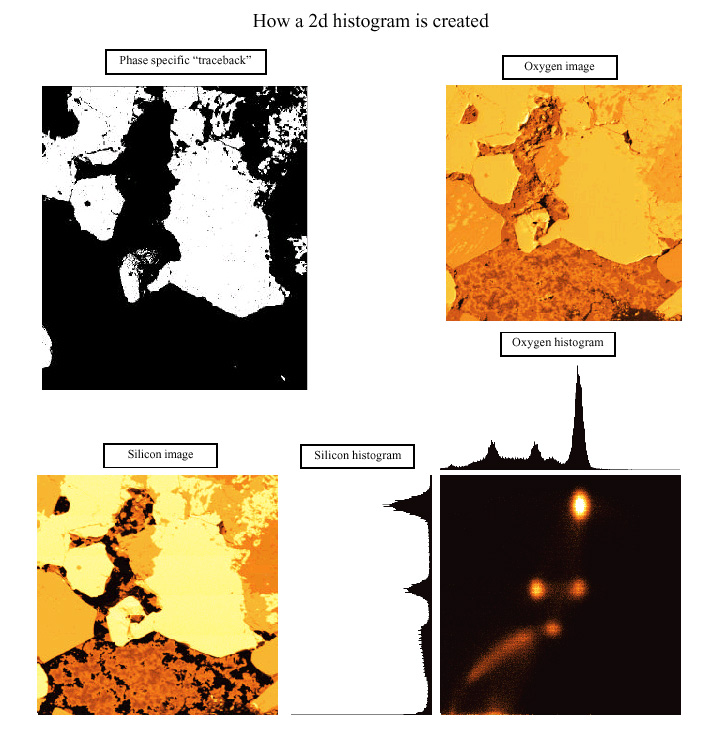
Graph showing how a 2-D histogram is created along with a "traceback" of the pixels grouped in the second to highest intensity correlation. Using this technique one can identify and locate specific phases based on element intensity ratios.
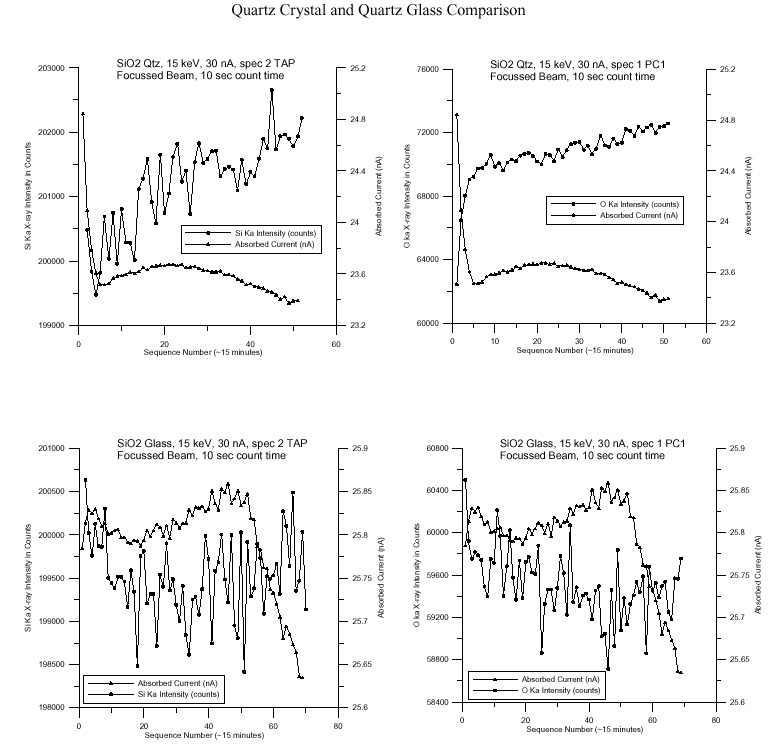
Graphs showing the effects of a focussed electron beam on both quartz single crystal and quartz glass. Noate that the quartz crystal exhibits severe changes in surface conductivity probably due to damage of the crystal lattice, although the precise mechanism is unknown.
Oxford Isis system EDS spectra of Cs2ReCl6 crystal. Note Cs MZ1 and Cs Mz2 lines (between 0.5 and 1.0 keV) are not identified by the software.
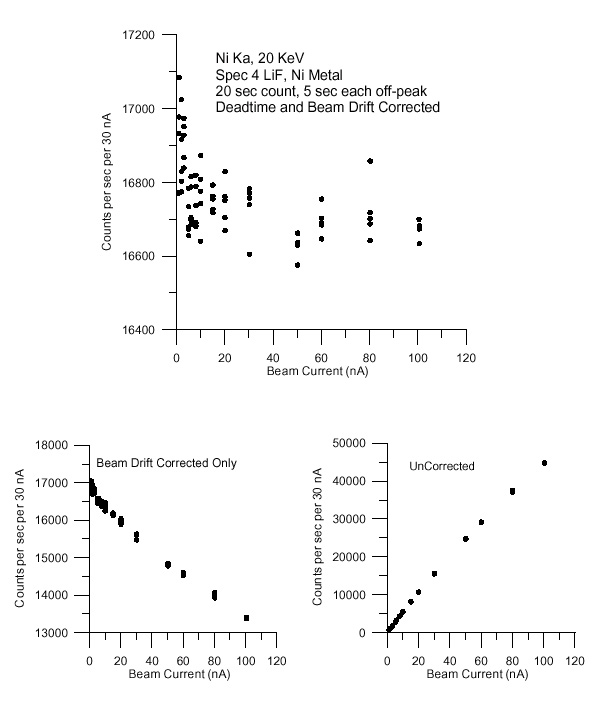
Faraday cup and x-ray count measurements showing variation at low levels (< 2 nA) not corrected by deadtime or beam normalization. Apparently seen on almost all instruments (both JEOL and CAMECA) and might be due to A-D converter non-linearity (pers. comm., John Armstrong, 2001).

University of Oregon, CAMCOR, Shared Facilities Poster (contact John Donovan for a full size poster).
The above plot is of S Ka count intensity deviation (in cps) corrected for matrix effects versus S weight percent as measured on VG-2 glass (#298, near zero concentration), anhydrite (#327), pyrrhotite (#757) and pyrite (#730). Each standard was re-peaked to compensate for the sulfur peak position shift and consequently each standard can be utilized as a primary standard for analyzing sulfur in diferent oxidation states in glasses.