![]()

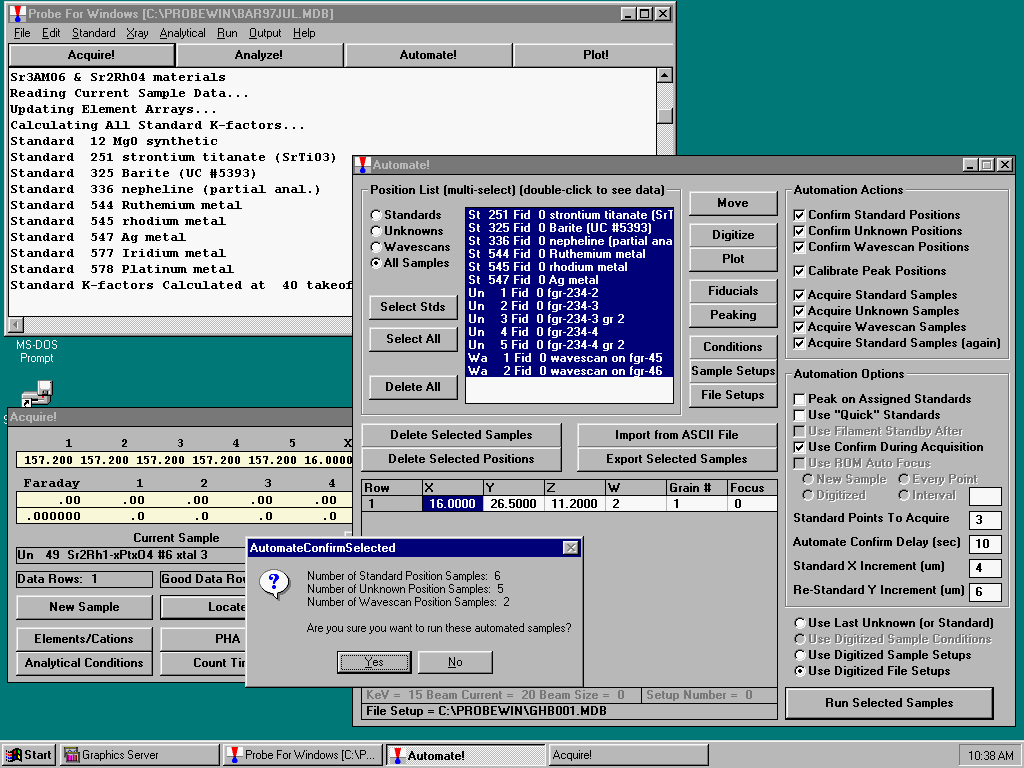
Note that the student is allowed to confirm stage positions, peak-center spectrometers, and acquire intensity data for standards, unknowns and wavescans in a single automated run to provide the greatest flexibility and ease of use, especially for those unfamiliar with the technique.

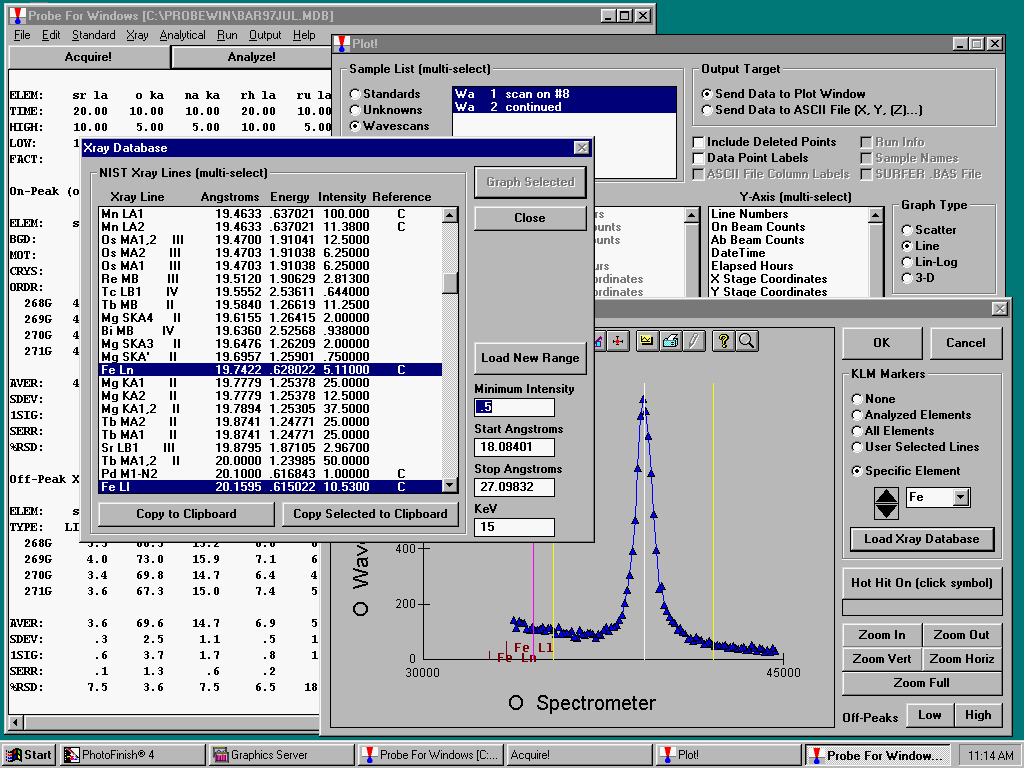
The application software keeps all intensity data in a single relational database for standards, unknowns and wavescans, allowing the student to browse a complete set of data from a probe session, so that the data can be easily transported to another computer for off-line processing.

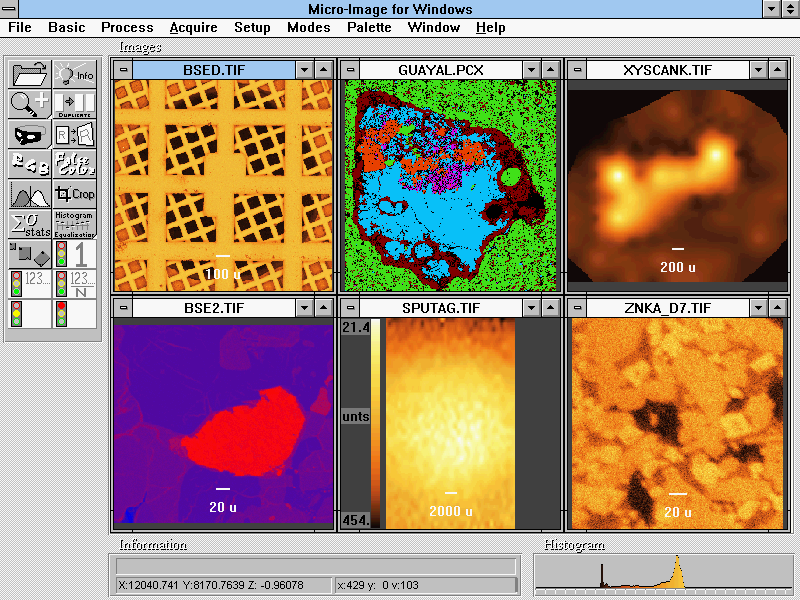
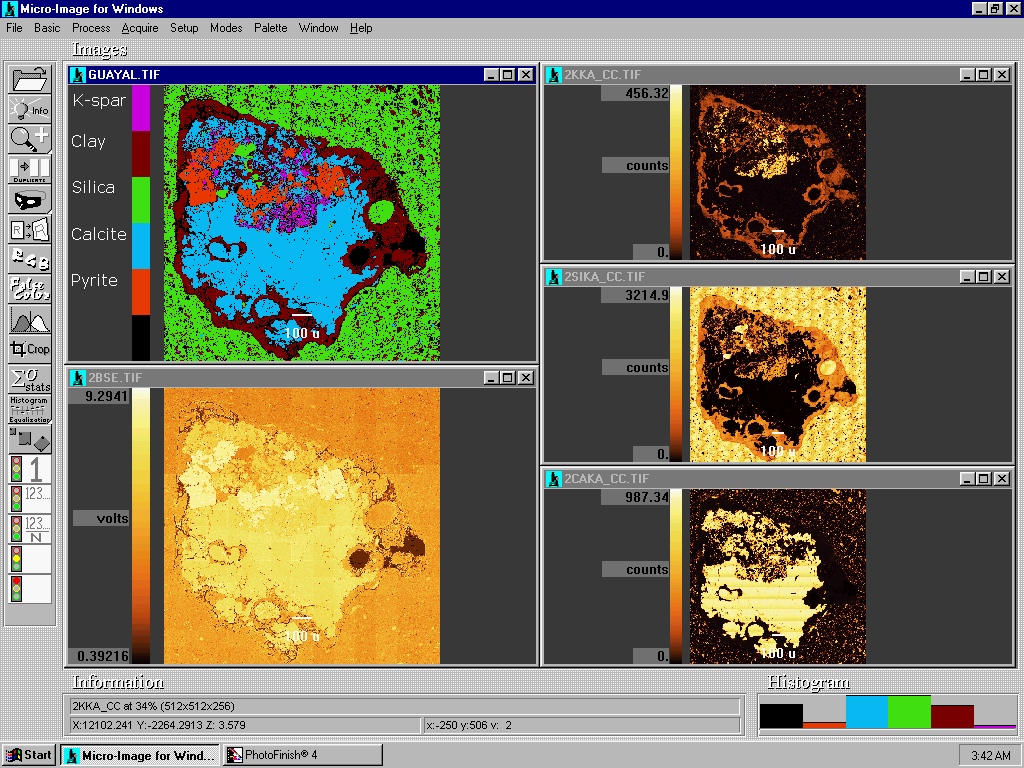
The student may not only display quantitative intensity and compositional data, but also image data from other sources such as SURFER grid files and USGS DEM (digital elevation map) files.

Intensity or compositional modal analysis is useful not only to determine phase abundance, but also to identify unknown or unanticipated phases.
Back To Department of Earth and Planetary Science Home Page