![]()
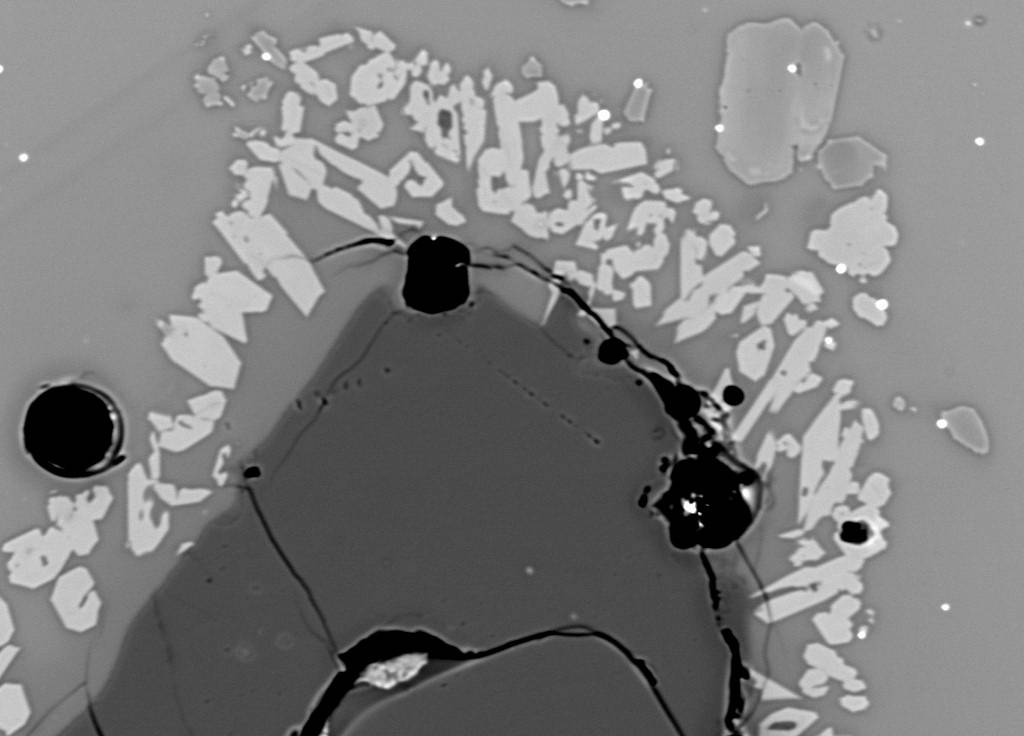
Backscatter image 1024 x 1024 at 15 KeV, 20 nA, approximate field of view is 250 um.
Experimental charge sample showing quartz grain with an augite rim. This texture occurs when xenocrystic quartz reacts with a basalt or andesite magma.
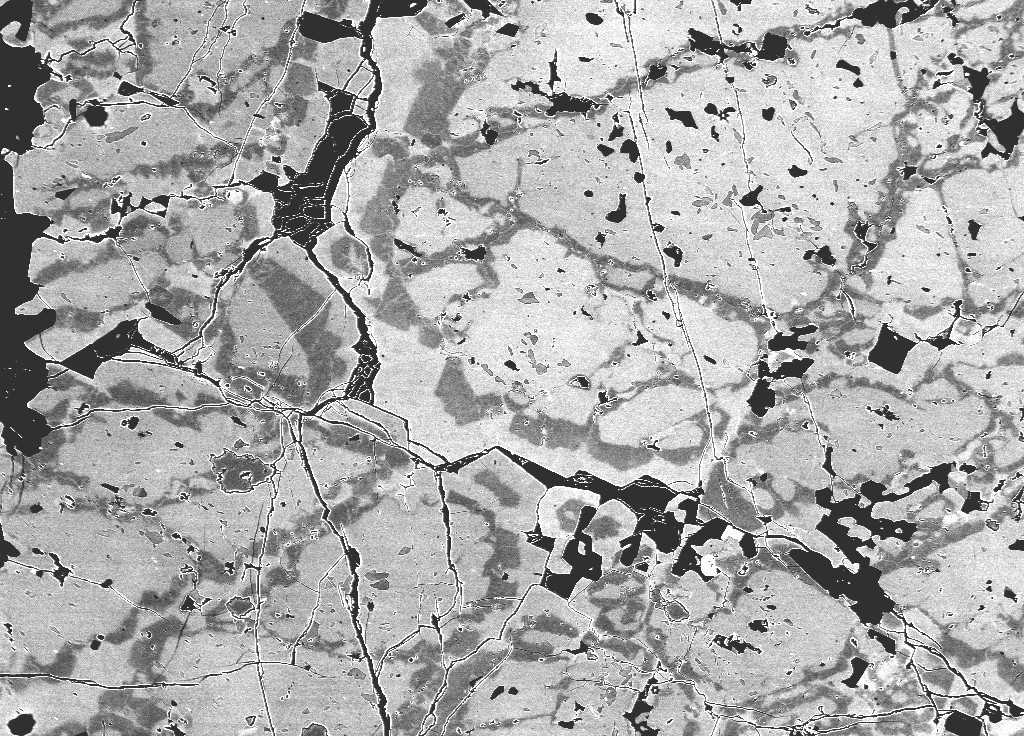
Backscatter image 1024 x 1024 at 15 KeV, 20 nA, approximate field of view is 500 um.
Complex compositional zoned garnet from an amphibolite in the Simplon Pass area of Switzerland. Darker gray (Alm60Gr26Py2Sp12) regions which show euhedral faces, indicate an initial stage of garnet growth. A change in conditions and perhaps a hiatus in metamorphism led to subsequent growth of the lighter (Alm60Gr26Py7Sp7) garnet around the earlier crystals, resulting in a larger composite garnet crystal.
O ka (left) and Si ka (right) x-ray maps, 15 KeV, 30 nA, 512 x 512 beam/stage mosaic image, 0.4 seconds per pixel, approximate field of view 1000 um. False color image using "thermal" color scale.
Copper silicate ore minerals from Atacama Desert, Chile. The images were automatically acquired using combined beam and stage control in order to image x-rays from the wavelength dispersive spectrometers without the Bragg defocusing usually associated with low magnification imaging. The acquisition time was approximately 30 hours.
Intensity 2-D histogram plot of the previous copper silicate ore minerals O ka (x-axis) and Si ka (y-axis) x-ray maps showing the phase correlation between the two x-ray images. From this technique we can observe that six distinct mineral phases are present in addition to a phase exhibiting a mixture of two phases or a variable composition.
By utilizing a "trace-back" feature (not shown) one can easily ascertain the spatial distribution of the individual phases in the field of view for the purposes of modal phase analysis.
Mg ka WDS x-ray map, 15 KeV, 20 nA, 512 x 512 pixels, 0.4 seconds per pixel. False color image using "thermal" color scale.
This image of a garnet-amphibole schist was acquired using the automatic mosaic imaging feature utilizing both beam and stage scanning. Note the subtle zoning in the garnet phases.
The beam scan magnification selected was 1000x in order to avoid Bragg defocusing, The image area scanned by the stage was 10 x 10 mm is area. This resulted in the acquisition of many thousands of beam scanned sub-images, that were automatically combined to create a single large x-ray map over a large area without any visible spectrometer defocusing effects.
Electron backscatter, 20 KeV, 20 nA. False color image using "thermal" color scale.
This image of silicate and sulfide phases is a manual mosaic of several randomly located electron backscatter images. Because each image automatically retains full stage registration as it is acquired, it is a simple matter to subsequently "concatenate" the images using a mosaic feature of the imaging software.
Note that due to the unfortunate nature of the SX-51 BSE detector compensating electronics, some variation in overall brightness is evident between the original sub-images.
Back To Department of Earth and Planetary Science Home Page